Estimating a Population Proportion
Learn how to construct confidence intervals for population proportions and determine necessary sample sizes.
Point Estimate
A point estimate is a single value used to estimate a population parameter. The sample proportion is the best point estimate for the population proportion .
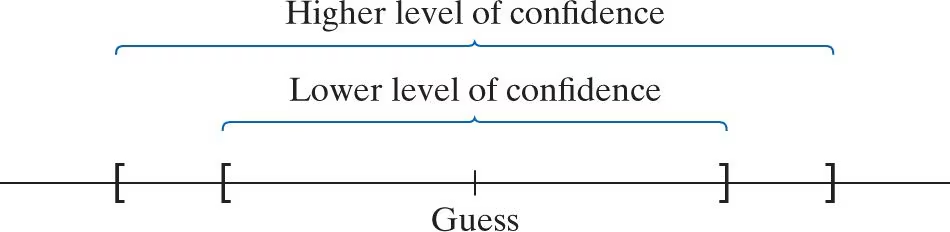
Confidence Interval
A confidence interval is an interval of numbers based on a point estimate that is likely to contain the unknown parameter.
Model Requirements
Interpretation: "We are 95% confident that the population proportion is between [lower] and [upper]." This means 95% of all possible samples will produce an interval that captures the true parameter.
Margin of Error
The margin of error (E) determines the width of the confidence interval.
The confidence interval is:
Determining Sample Size
With Prior Estimate
Use when a prior estimate from a previous study exists.
Without Prior Estimate
Use to ensure a large enough sample.
Important: Always round the resulting n up to the next integer.
Try It Yourself
Confidence Interval Calculator
≥ 10 ✓
Calculations
Interpretation: We are 95% confident that the true population proportion is between 0.3233 and 0.5167.
LogicLens Practice Suite
Log in to Access Adaptive Practice
Our AI engine generates unique practice problems based on your progress.