Properties of the Normal Distribution
Understand the characteristics of the bell curve, the role of area as probability, and the continuous uniform distribution.
Uniform Probability Distribution
Before diving into the normal curve, simpler continuous distributions help illustrate key concepts. In a Uniform Distribution, values are equally likely across a range .
Key Concept: Area = Probability
For continuous variables, . Instead, we calculate probability over an interval. The probability is the Area under the curve (PDF) for that interval.
- Total Area under the graph must equal 1.
- Height of the graph must be .
- For uniform: Height = (making it a rectangle).
Uniform Distribution Explorer
Parameters
Find Probability
Graphing the Normal Curve
The Normal Distribution (or Gaussian) is the most important distribution in statistics. It is defined entirely by two parameters: the mean () and the standard deviation ().
Normal Curve Explorer
Shifts the curve left/right
Controls spread/flatness
Symmetric?Yes
Peak at:x = 0
Inflection Pts:-1, 1
Effect of
The Mean determines the center. Increasing shifts the entire curve to the right.
Effect of
The Std Dev determines the spread. Increasing flattens the curve (peaks lower).
Properties of the Normal Curve
Critical Characteristics
- Symmetric: The left side is a mirror image of the right side around .
- Single Peak: The highest point is at . Here, Mean = Median = Mode.
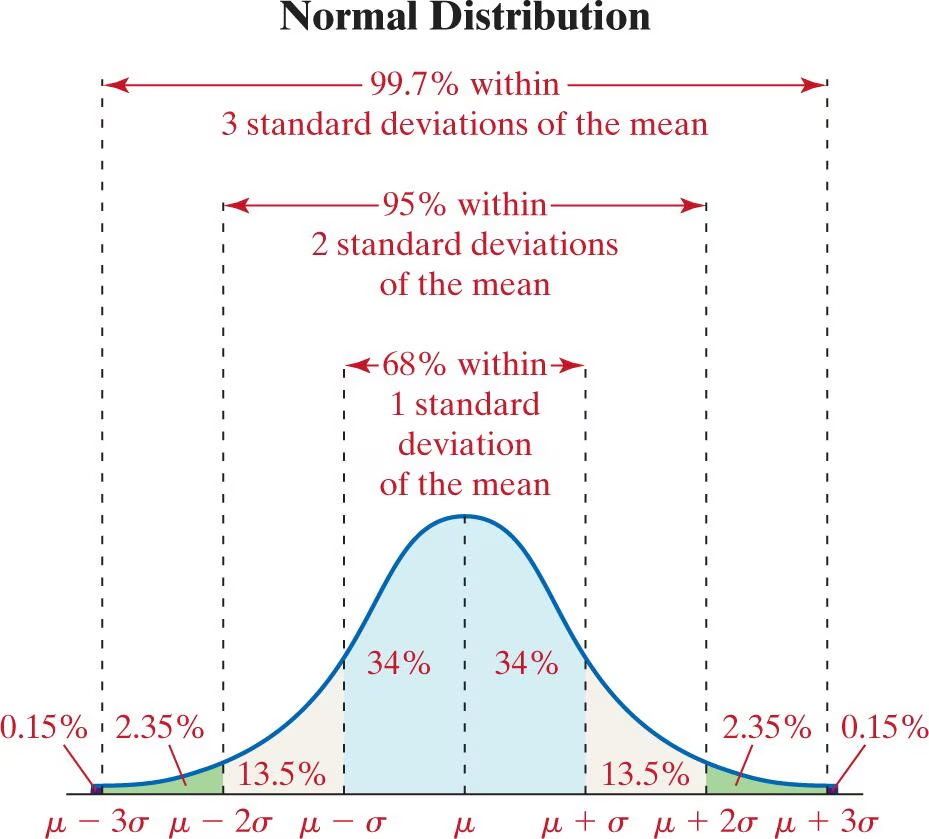
- Inflection Points: The curve creates "shoulders" (concavity changes) exactly at and .
- Asymptotic: The tails approach, but never touch, the horizontal axis.
The Empirical Rule
Role of Area in PDF
Area = Probability
Because a continuous variable has infinite possible values, the probability of getting exactly one specific number (e.g., exactly 120.000000 lbs) is zero.
Therefore, we always calculate the probability that the variable falls between two values. This corresponds to the area under the density curve between those points.
LogicLens Practice Suite
Log in to Access Adaptive Practice
Our AI engine generates unique practice problems based on your progress.